


Introduction
Parkinson disease (PD) is a prevalent neurodegenerative disorder characterized by movement symptoms such as resting tremor, bradykinesia, rigidity, and various non-motor symptoms [1]. These motor and non-motor symptoms, such as neuropsychological problems and gastrointestinal dysfunction, have been identified as contributing factors to malnutrition [2]. It is increasingly reported that approximately 3% to 60% of patients with PD are at risk of nutritional deficiencies [3]. The nutritional status of PD patients is known to affect their quality of life and daily functioning [4]. Specifically, elderly patients with PD are susceptible to nutritional deficiencies due to compromised digestive function, reduced bioavailability, and altered drug responses [5]. Malnutrition in PD patients increases the risk of hospitalization, delays recovery from illness, raises the risk of osteoporosis and falls, and significantly reduces survival prospects [6]. Hence, regular evaluation of the nutritional status is important for preventing malnutrition and its complications in PD patients.
While malnutrition has not been clearly defined, the mini nutritional assessment-short form (MNA-SF) is a tool that can identify the risk of malnutrition through a simple assessment [7]. The MNA-SF assessment collectively serves to predict adverse health outcomes, social functioning, hospitalization period, and mortality [8]. Notably, the effectiveness of MNA-SF in the Korean elderly population has been demonstrated to identify those who are vulnerable to malnutrition [9].
Previous studies have established associations between malnutrition, as measured by mini nutritional assessment, and motor and non-motor symptoms in PD patients [10]. Results from a study in a Chinese patient population demonstrated relationship between malnutrition and unified Parkinsonâs disease rating scale (UPDRS) motor scores [11]. Based on these findings, we hypothesized that patients diagnosed with PD over the age of 70 experience more pronounced deterioration in nutritional status, which has a greater impact on PD symptoms. Our aim was to evaluate the interaction between nutritional status, as measured by MNA-SF, and the motor and non-motor symptoms that characterize PD in elderly patients.
Methods
1. Study population
Between March to August 2023, 48 individuals were recruited from the Department of Neurology at the Veterans Health Service Medical Center. The inclusion criteria were as follows: (1) PD diagnosis based on the on the clinical diagnostic criteria of the United Kingdom PD Society Brain Bank; (2) reduced dopamine transporter availability on 18F-FP-CIT scan; (3) ability to complete the UPDRS scale measurement; (4) voluntary agreement to participate in the study.
The exclusion criteria were as follows: (1) secondary parkinsonism or atypical parkinsonism; (2) advanced PD stage, Hoehn and Yahr (HY) stage 4 or 5; (3) severe mental illness, including major depressive disorder, bipolar disorder, and schizophrenia, or chronic diseases such as heart, liver, and kidney disease that can affect nutritional status.; (4) gastrointestinal diseases or wasting diseases such as infection or tumor. All participants provided written informed consent to participate in the study, and the study protocol received approval from the Institutional Review Board of Veterans Health Service Medical Center (approval number: 2022-12-040-001).
2. Outcome measure
Motor and non-motor symptoms of PD were measured using UPDRS clinical scale, which was evaluated by a neurologist. The UPDRS is the most commonly used scale in clinical studies of PD, allowing for the evaluation of PD severity in various aspects, including non-motor symptoms (part I), activities of daily living (ADL) (part II), and the motor test (part III). Higher scores on the UPDRS indicate a greater degree of disability [12,13].
3. Exposure
Nutritional assessment was conducted using the MNA-SF. The MNA-SF serves as a nutritional screening tool capable of identifying malnutrition and individuals vulnerable to malnutrition [7]. A Korean version of this assessment is also available and has been validated [9]. This scale encompasses 6 components: food intake, weight fluctuations, mobility, acute illnesses, neuropsychiatric considerations, and body mass index. The overall score achievable through the questionnaire is 14 points, with a score less than 7 indicating malnutrition, a score ranging from 7 to 11 indicating a risk of malnutrition, and a score of 12 representing normative nutritional status. For the purposes of this study, patients with an MNA-SF score of less than 7 (indicative of malnutrition) and those scoring between 7 and 11 (suggesting a risk of malnutrition) were combined into a category termed âabnormal nutritional status.â
4. Covariate variables
The HY stages are used to categorize PD based on its severity. Stage 1 represents a phase characterized by unilateral symptoms, while stage 2 signifies the presence of bilateral symptoms. Both stages 1 and 2 correspond to the early phase of the disease. Stage 1.5 involves symptoms affecting the unilateral side as well as axial symptoms. Stage 3 signifies a state of moderate disease progression, while stages 4 and 5 represent severe stages and are not considered within the scope of this study.
The Korean-mini mental state examination (K-MMSE), a concise cognitive assessment, measures cognitive capacity on a scale of up to 30 points. Within the Korean population, a cutoff value of less than 24 is recommended for individuals with a middle school education or higher, indicating cognitive decline. For those with an elementary school education or above, the cutoff is 20 points, while for illiterate individuals, it is 17 points.
5. Statistical analysis
Data are presented as meanÂąstandard deviation for continuous variable and as numbers(percentages) for categorical variables. The distribution of data was assessed using the Shapiro-Wilk test, and comparisons between the 2 groups were performed using the independent t-test or Mann-Whitney U test for continuous variables, and the chi-square test for categorical variables. The relationship between MNA-SF and UPDRS scores was confirmed by Spearman and Pearson correlation analysis. Linear regression analysis was employed to explore the relationship between MNA-SF and UPDRS scores. Multicollinearity was assessed using the variable inflation factor (VIF), and covariates with a VIF >5 were excluded from the analysis. Statistical significance was determined at a p-value of <0.05, using a 2-tailed approach. The entire statistical analysis was performed using the R ver. 3.5.1 (R Foundation, Vienna, Austria).
Results
1. Clinical characteristics
The characteristics of a total of 48 male PD patients are presented in Table 1. The mean age of PD onset was 76.8Âą2.6 years, and the average disease duration was 3.4Âą2.8 years. According to the MNA-SF evaluation criteria, 26 subjects (54%) were at risk of malnutrition, 10 subjects were malnourished, and 36 subjects (75%) had an abnormal nutritional status. Underlying conditions such as diabetes mellitus, hypertension, hyperlipidemia, and drinking and smoking habits were similar in both the abnormal and normal nutritional status groups. Regarding the HY stage of the participants, there were 23 (47.9%) individuals at stage 1, 4 (8.3%) at stage 1.5, 19 (39.6%) at stage 2, and 2 (4.2%) at stage 3. The distribution of participants across these stages was similar when categorized by nutritional status. However, there was a significant difference in K-MMSE scores between the 2 groups, with the normal nutritional status group scoring 27.4Âą2.3 points, which was higher than the 22.9Âą5.1 points in the abnormal nutritional status group.
2. Association between UPDRS score and nutritional status
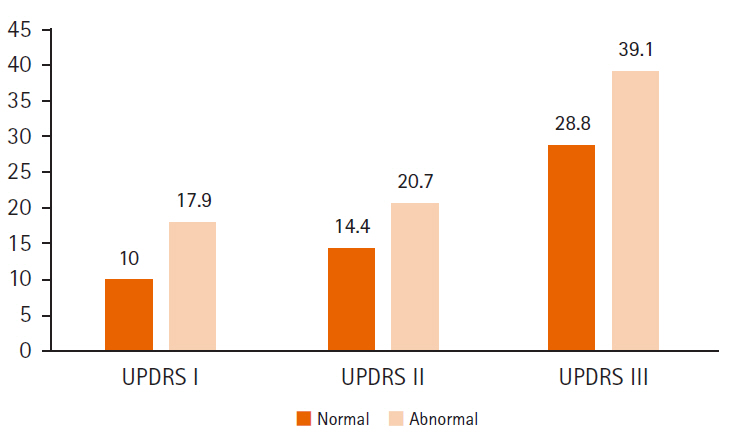
As for the UPDRS score according to nutritional status groups, the normal nutritional status group showed significantly lower scores compared to the abnormal nutritional status group in UPDRS scores (Table 1), which encompass non-motor symptoms, ADL and motor symptoms: 28.8 vs. 39.1 in the UPDRS I, 14.4 vs. 20.7 in the UPDRS II, and 10.0 vs. 17.9 vs. in the UPDRS III (Figure 1).
The correlation coefficient between the MNA-SF score and UPDRS score is delineated in Table 2. The correlation coefficients were statistically significant with UPDRS I (r=-0.49, p=0.0003) UPDRS II (r=-0.45, p=0.0015), UPDRS III (r=-0.38, p=0.0071) and total UPDRS (r=-0.54, p<0.001). Table 3 displays the results of the linear regression analysis for UPDRS scores and MNA-SF scores. The regression coefficient of the UPDRS I, UPDRS II, UPDRS III and total UPDRS were negatively associated with an increase in MNA-SF scores. This relationship persisted even after adjusting for HY stage, K-MMSE score, and PD duration.
Discussion
Out study confirmed a correlation between nutritional status and both motor and non-motor symptoms in the elderly PD patients. The proportion of subjects at risk of malnutrition and malnutrition was high at 75%, and nutritional status was found to be associated with both motor and non-motor symptoms.
A MNA-SF evaluation of 300 elderly inpatients in Korea found that 33% were at risk of malnutrition, and 17% were malnourished [9]. The rates of malnutrition and risk of malnutrition observed in elderly inpatients with PD were higher than those reported in community-dwelling elderly patients [6,14]. A systematic review indicated malnutrition rates of 0% to 2% and malnutrition risk rates of 20% to 34% in PD [15]. In our study, among the 48 participants, 10 (20.8%) were malnourished and 26 (54.2%) were at risk of malnutrition, indicating an overall higher incidence compared to patient with PD in the previous study. Individuals aged 70 years or older who are diagnosed with PD might experience a higher prevalence of malnutrition compared to those with the condition. Our results can be attributed to the specific characteristics of this group.
Our result demonstrates a significant association between the nutritional status of PD patients and their motor symptoms. Patients with abnormal nutritional status exhibited more severe symptoms in both daily activities (UPDRS II) and clinical assessments of motor function (UPDRS III) than those with normal nutritional status. A previous study involving 96 PD patients revealed a significant inverse correlation between the mini nutritional assessment score and the UPDRS score (Spearman r, -0.48; p<0.001) [16]. Another study, comparing 12 PD patients with 8 healthy, age-matched controls and measuring resting energy expenditure, found that individuals with PD had increased resting energy expenditure compared to the control group, with a relationship to muscle rigidity [17]. With disease progression, motor symptoms such as tremor, rigidity, and abnormal movement patterns contribute to increased energy expenditure, potentially leading to weight loss and malnutrition. Elderly PD patients are recognized for exhibiting elevated rigidity and UPDRS motor severity [18,19]. This could perpetuate a vicious cycle in which malnutrition-induced muscle weakness, loss of muscle mass, exacerbation of tremor, and impaired balance aggravate PD motor symptoms [20].
Furthermore, our findings suggest an association between abnormal nutritional status and non-motor symptoms. Sensory disturbances, neuropsychiatric symptoms, and gastrointestinal dysfunctions in early-stage PD could contribute to malnutrition [21,22]. The prevalence of depression in elderly PD patients is remarkably high, at 75% [23]. Accumulating evidence shows that PD patients with poor nutritional status often experience elevated levels of depression and anxiety [24-26]. Mood disorders can disrupt appetite and neuroendocrine signaling, interfering with dietary regulation [27]. Additionally, the decline in dopaminergic function accompanying PD progression could impair reward-driven behaviors, potentially leading to imbalanced nutrition due to reduced appetite [20].
The digestive impairments inherent to PD, including dysphagia, gastroparesis, and colonic dysmotility, can contribute to reduced energy intake due to the decreased desire to eat [28]. Our results indicate that elderly PD patients frequently exhibit symptoms associated with nutritional status, including rigidity, neuropsychiatric symptoms, and gastrointestinal dysfunctions, all of which are prevalent in the elderly population. These findings underscore the considerable prevalence of malnutrition in elderly PD patients and suggest that nutritional status may influence both motor and non-motor symptoms of PD. Therefore, it is needed to evaluate the nutritional status of patient with PD to provide the adequate nutritional interventions.
However, there are several limitations of this study. The limited sample size of elderly male participants and the cross-sectional design necessitate careful interpretation and cautious generalization of the findings Specifically, due to the exclusive inclusion of males in the study, it becomes challenging to extend the findings to a broader population; therefore, further examination with a larger sample is warranted. The constrained sample size might limit the comparison of nutritional status based on UPDRS score items, resulting in an analysis gap regarding the symptoms with greater impact. We did not include gastrointestinal disorders or cancer, which could act as confounding factors affecting participants' nutritional status. However, during participant selection, we deliberately excluded individuals with digestive disorders or chronic conditions such as cancer, heart disease, liver disease, or kidney disease. Nonetheless, our study serves as a basis for a future, larger study with additional patient enrollment.
In conclusion, our study suggests an association between nutritional status and both motor and non-motor symptoms of PD in elderly patients. Given the frequency of malnutrition in the elderly and its relationship to PD severity, it is imperative for clinicians to consistently assess the nutritional status of elderly PD patients.
 PDF Links
 PubReader
 ePub Link
 Full text via DOI
 Download Citation
 Print
Print