Comparison of three definition of the metabolic syndrome in Korean patients with acute ischemic stroke
Article information

Abstract
Background
The metabolic syndrome (MetS) is a cluster of risk factors for atherosclerotic arterial disease including acute ischemic stroke but little is known about prognostic impact in acute ischemic stroke patients. Several diagnostic criteria have been proposed by number of organizations. So we aimed to investigate the prevalence of MetS according to different diagnostic criteria.
Methods
Patients with acute ischemic stroke were performed to estimate the prevalence of MetS using the 3 definitions of MetS: the National Cholesterol Education Program Adult Treatment Panel-III (NCEP ATP-III), the International Diabetes Federation (IDF) and Joint Interim Societies (JIS) MetS definition. One year mortality and morbidity of all cause and vascular cause was evaluated according to individual definition.
Results
Among total 914 patients, the MetS prevalence was 32.5%, 37.2% and 56.6% with the NCEP, IDF and JIS definitions. Central obesity was more frequently observed in patients diagnosed with MetS by IDF and JIS definition than patients with MetS by NCEP ATP-III definition. One year mortality of all cause was 6.9% in the whole study population and 5.4%, 4.4% and 5.8% according to the NCEP ATP-III, IDF and JIS definitions. Age and C-reactive protein was positively in contrast, the IDF and the JIS definitions were negatively predicted 1-year mortality.
Conclusions
The prevalence of MetS was higher with JIS definitions in comparison with other 2 definitions. But JIS and IDF definitions were negatively predicted 1 year mortality. These findings suggest needs for further study for prognostic impact of individual MetS definition in patients with acute ischemic stroke.
Introduction
The metabolic syndrome (MetS) is a cluster of risk factors for atherosclerotic arterial disease including acute ischemic stroke [1]. Patients with MetS showed higher incidence of cardiovascular disease (CVD) and death [2]. Although insulin resistance and central obesity suggested as key factors in pathogenesis of MetS [3], agreement for central obesity has not been made worldwide. So several MetS definitions have been proposed according to cut off value of abdominal circumferences and inclusion of central obesity as a mandatory component. Most commonly used MetS definitions are the National Cholesterol Education Program Adult Treatment Panel-III (NCEP ATP-III) definition [1] with 102 cm and 88 cm as a cut off value of waist circumferences for man and woman respectively, and the International Diabetes Federation (IDF) definition that is characterized with mandatory inclusion of abdominal obesity [4]. The 2009 Joint Interim Societies (JIS) MetS definition with lower cut off value of abdominals circumferences (man, 90 cm; women, 80 cm) that are not mandatory was proposed [5]. Population base studies showed prevalence of MetS and prediction rate for CVD risk was various according to different MetS definitions [6–8]. But little information has been provided for the patients with acute ischemic stroke.
So we aimed to compare prevalence rates and evaluate predictability of 1 year mortality using NCEP ATP-III, IDF and JIS definitions of MetS in acute ischemic stroke patients.
Methods
1. Subject
The Stroke Registry (SR) prospectively enrolled 910 patients from November 2008 to August 2012 who were diagnosed with acute ischemic or transient ischemic attack (TIA) which were confirmed by diffusion weighted magnetic resonance image (DWI). Here, TIA refers to a patient whose clinical manifestations are TIA and acute ischemic changes confirmed on DWI. This is a study conducted by a single institution, a retrospective study and IRB exempt study. Detailed flow chart was demonstrated in Figure 1. Demographic characteristics, stroke risk factors including hypertension, diabetes, smoking, atrial fibrillation, previous stroke history and past medication history were evaluated for all patients registered in SR Abdominal circumference were checked within 3 days after admission at supine position. During follow-up period, all patients prescribed proper antithrombotics and statin medication. One year mortality and morbidity of all cause according to individual definition was evaluated. One year mortality and morbidity was checked at the day (±14 days) after 1 year from admission date by telephone survey for the patients who are not followed up to outpatients clinic, or by interview for the patients who visit our hospital regularly.
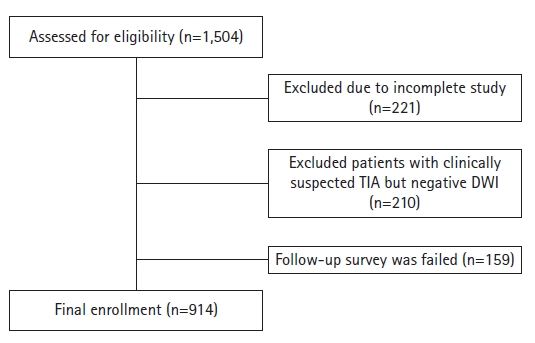
Patient enrollment follow chart. TIA, transient ischemic attack; DWI, diffusion weighted image.
2. Laboratory tests and definitions of metabolic syndrome
Laboratory test including glucose, total cholesterol, high density lipoprotein cholesterol (HDL-C), triglyceride (TG) and C-reactive protein (CRP) after an overnight 12-hour fasting were checked with standard method. The prevalence of MetS was estimated using the 3 definitions of MetS: NCEP ATP-III, IDF and JIS MetS definition (Table 1).

Three different definitions of metabolic syndrome
3. Statistical analysis
SPSS ver. 18.0 (SPSS Inc., Chicago, IL, USA) was used for all statistical analyses. Mean and standard deviation of the numerical variables are reported. For variables (CRP, fasting glucose, TGs) with skewed distributions by Kolmogorov-Smirov test, log-transformed values were used in the analysis. For evaluating impact of each definition of MetS for mortality, logistic regression analysis was used adjusted with sex, age, previous stroke history, smoking, statin medication history and serum CRP concentration. Each of the 3 MetS definitions was analyzed independently in multiple logistic analysis. A 2-tailed p-value <0.05 was considered significant.
Results
1. MetS prevalence
Total 1,504 patients were admitted during the study period. Due to incomplete study, 221 patients were excluded. Two hundred and 10 patients with clinically suspected TIA but negative DWI were also excluded. Follow survey was failed in 159 patients. Finally, 914 patients were enrolled (Figure 1). Patient distribution according to presence of MetS by 3 definitions is illustrated in Figure 2. Nearly all subjects with MetS diagnosed by the NCEP ATP-III, IDF definitions were belonging to the category of patients with JIS definition, because JIS definition has more comprehensive criteria.
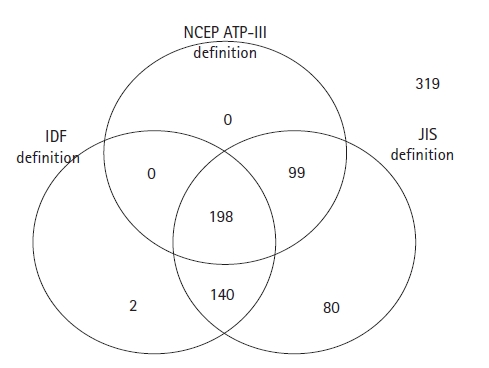
Diagram of patient` distribution according to presence of metabolic syndrome by National Cholesterol Education Program Adult Treatment Panel-III (NCEP ATP-III), International Diabetes Federation (IDF), Joint Interim Societies (JIS) definition.
Table 2 showed baseline characteristics of patient when criteria of the 3 different definitions were used. The MetS prevalence was 32.5%, 37.2% and 56.6% with the NCEP ATP-III, IDF and JIS definitions. In patients identified as having MetS, past history of hypertension, and diabetes mellitus (DM) were present in over 40% of individuals by all 3 definitions. Prevalence of women was higher according to all 3 definitions (59.6% for NCEP ATP-III, 64.7% for IDF and 54.4% for JIS definitions).

Baseline characteristics according to presence of the metabolic syndrome, by 3 definitions
Subjects with MetS diagnosed by the NCEP definition had higher prevalence of type 2 DM (73.1%), and low HDL-C (78.8%) than those with MetS diagnosed by the IDF (65.6%, 65.9%) and JIS (70.6%, 66.3%) definition respectively (Table 3).
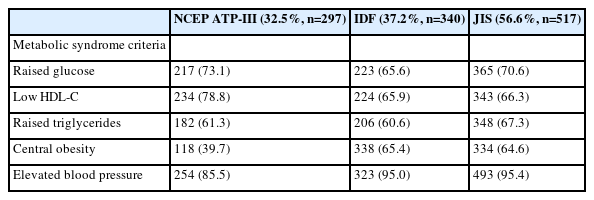
Proportion of individuals with metabolic syndrome fulfilling each criteria of the syndrome
Instead, patients with central obesity and elevated blood pressure counted larger proportion in patients diagnosed with MetS by IDF (99.4%, 95.0% respectively) and JIS definitions (64.6%, 95.4% respectively) than those with MetS diagnosed by NCEP ATP-III definition (39.7%, 85.5% respectively).
2. One year outcome
One year mortality of all cause was 6.9% (n=67) in the whole study population and 5.4% (n=16), 4.4% (n=15) and 5.8% (n=30) patients were recorded in patients diagnosed with the NCEP ATP-III, IDF and JIS definitions. Among them, cerebrovascular cause was recorded in 9 (56.3%), 9 (60%) and 19 (63.3%) patients, respectively. In 47 patients, stroke was recurred, but any factor showed no significant association.
Older age (odds ratio [OR], 1.122; 95% confidence interval [CI], 1.089–1.155; p<0.001), presence of atrial fibrillation (OR, 2.805; 95% CI, 1.566–5.024; p=0.001) and higher serum concentration of CRP (OR, 1.821; 95% CI, 1.548–2.143; p<0.001) significantly predicted 1 year mortality (Table 4). No patient who took statin medication before admission was expired. In contrast, higher BMI (OR, 0.848; 95% CI, 0.765–0.941; p=0.002), thicker waist (OR, 0.957; 95% CI, 0.928–0.987; p=0.005), and presence of MetS defined by IDF (OR, 0.436; 95% CI, 0.257–0.937; p=0.011) and JIS criteria (OR, 0.599; 95% CI, 0.363–0.989; p=0.045) showed negatively predicted 1 year mortality.
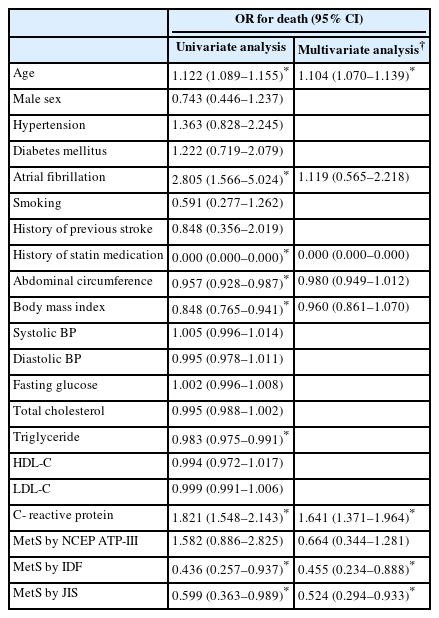
Significant factors for 1 year mortality for all cause
Multivariate analysis was performed adjusted with significant factors at univariate analysis. Abdominal circumference, body mass index and serum concentration of TG were excluded because of statistical interaction with presence of MetS. After adjusted age, presence of atrial fibrillation, statin medication history and CRP, MetS by IDF (OR, 0.455; 95% CI, 0.234–0.888; p=0.021) and JIS (OR, 0.524; 95% CI, 0.294–0.933; p=0.028) criteria was significant.
Discussion
This study compared 3 different commonly used MetS definitions, NCEP ATP-III, IDF and JIS definitions. It has been previously reported that MetS is a risk factor for ischemic stroke and that prevalence varies depending on various definitions of MetS, but there have been few reports on its effect on stroke mortality.
In this study of patients with acute ischemic stroke, MetS prevalence was 32.5%, 37.5% and 56.5% by NCEP ATP-III, IDF and JIS definition respectively. That was similar rate with previous reports with acute coronary syndrome that reported MetS prevalence as 46% and higher than the rate of general Korean population (17.5%–26.7%) [9]. It was confirmed once again that MetS is a risk factor for ischemic stroke.
Because of lower cut off value of waist circumference, all patients with MetS by NCEP definition was belonging to patients with MetS by JIS definition (Figure 2). The use of central obesity as mandatory criteria by the IDF could result in the exclusion of subjects with ≥3 of the remaining 4 criteria, but corresponding patients were only 2. Therefore, although not required for inclusion in the IDF definition, the lower cutoff threshold for waist circumference determined the difference in MetS prevalence between the three definitions.
Contrary to the fact that MetS is generally known to be a risk factor for stroke, the mortality rate was found to be reduced in patients with MetS compared to patients without MetS even when 3 different definitions of MetS were applied (Table 4). The OR for 1 year mortality rate was 0.66 (95% CI, 0.34–1.2) by NCEP ATP-III definition, 0.45 (95% CI, 0.23–0.88) by IDF definition and 0.52 (95% CI, 0.29–0.93) by JIS definition. Statistically, only the IDF definition and the JIS definition were significant for 1 year mortality.
Interestingly, the markers of over-nutrition including higher BMI, thicker waist, higher serum concentration of TG and presence of MetS showed better 1-year survival rate in patients with acute ischemic stroke. These findings may be interpreted in line of association between poor nutrition and poor outcome. Overweight and normal weight patient showed more than 2 times better survival after stroke than underweight patients [10]. In fact, there has been controversy in relationship between mortality and serum lipid level that are component of MetS. Generally, lower serum cholesterol level is regarded as a marker for poor outcome in hemorrhagic stroke, inverse relationship is suggested in ischemic stroke [11,12].
MetS was associated with poor prognosis and higher occurrence of CVD in 10-year longitudinal follow-up cohort study [8]. But there have been many reports in opposite point of view since 1990. Higher serum cholesterol concentrations were associated with reduced long-term mortality after stroke [13–15]. Low TG, not low total cholesterol concentration, independently predicts poor outcome after acute stroke [16].
Another considering point is there was no patient of death who previously took statin medication and patients enrolled in our study took statin medication during whole follow- up period. As we know, statin therapy reduce major vascular event including ischemic stroke, acute coronary syndrome and peripheral artery disease [17–19]. Regular statin prescription for patient of ischemic stroke may influence to the prognostic impact of MetS. Therefore, diagnosis of MetS in patient with acute ischemic stroke after admission may have different meaning with diagnosis in general population as seen in our study. In general population, MetS is well known risk factor for cerebrovascular disease [20,21], silent brain lesion [22] but in patients already diagnosed with cerebrovascular disease at statin era, MetS might not work as an absolute risk factor for poor prognosis.
Comparing 3 definitions, NCEP ATP-III definition that are most strict and include more diabetic patient, showed relatively poor prognosis (statistically not significant). For subjects were general population, higher predictability for CVD [7,8] and ischemic stroke [23] of NCEP ATP-III definition than that of IDF definition has been reported in several studies. While no significant impact on prognosis in patient with acute ischemic stroke was reported in recent paper [24].
The limitations of this study are as follows: since analysis of the pathogenesis based on toast classification was not performed in these patients. and, it is difficult to know the reason why the 1 year stroke mortality rate decreases in patients with MetS from this study, future follow-up research appears to be necessary.
In conclusion, the prevalence of MetS in patients with acute ischemic stroke was 32.5%, 37.5%, 56.5% by NCEP ATP-III, IDF and JIS in this study. Even though different definitions of MetS were applied, the 1-year mortality rate in stroke patients with MetS was confirmed to be lower than in patients without MetS. These findings suggest needs for further defined definition to diagnose and application MetS in Korean patients.
Notes
Conflicts of Interest
The authors have no potential conflicts of interest to disclose.
Funding
None.
Author Contributions
Conceptualization: IUS; Data curation: EH, HJC; Supervision: IUS, SWC; Writing–original draft: HJC, IUS; Writing–review & editing: all authors.